Piedmont Ancestry in Chalcolithic West Asia (It’s not just Armenia)

Thanks to Skourtanioti et al , 2020, We now have samples that can help to fill in the picture of how populations in West Asia formed. Some of the most important, in my opinion, are the Halaf-era samples from Tell Kurdu and the Shulaveri-Shomu individuals from Azerbaijan. These were a couple of the important groups yet to be seen.

One of the interesting individuals is ART038, a Chalcolithic individual from Arslantepe. The interesting part of this individual is that they are R1b-V1636. While the paper does not delve into this individual much or look at complex models, I wanted to double check on this myself.

First things was to make sure that it was Halaf (Tell Kurdu) and not another group like Buyukkaya_EC that delivered the Anatolian ancestry. Several different looks at this in qpAdm confirmed for me that the Chalcolithic of Eastern Anatolia and the Caucasus required excess Levant PPN ancestry found in the Tell Kurdu individuals.

To flesh out any Piedmont ancestry and the different streams such as CHG and Iranian, I used the Late Neolithic individual from Ganj Dareh in the left pops (pleft) and Meshoko, with Ganj Dareh in the right pops, or outgroups (pright). The populations in the pright are Chimp, Ust_Ishim, Kostenki14, Brazil_LapaDoSanto_9600BP, Yana, WHG, EHG, Tianyuan, Mongolia_N_North, Taiwan_Hanben, West_Siberia_N, Levant_N, Ganj_Dareh_N, IBM, Barcin_N and Meshoko. This group allowed for the best resulting outputs.

Not only did I look to see if EHG or Piedmont ancestry is in these Chalcolithic samples, but even in the Late Neolithic Shulaveri-Shomu. Interestingly enough, they can be modeled with minor ancestry from a group like the Piedmont Eneolithic.

Shulaveri-Shomu

left pops:

Shulaveri_Shomu

TellKurdu_EC

CHG

Iran_LN

Piedmont_Eneolithic

numsnps used: 286501

best coefficients: 0.617 0.143 0.152 0.087

std. errors: 0.026 0.077 0.047 0.032

fixed pat wt dof chisq tail prob

0000 0 12 6.866 0.866351 0.617 0.143 0.152 0.087

While not completely necessary, Shulaveri Shomu can be modeled as deriving ~9% of their ancestry from the Piedmont.

Armenia Chalcolithic

left pops:

Armenia_ChL

TellKurdu_EC

CHG

Piedmont_Eneolithic

numsnps used: 471814

best coefficients: 0.483 0.226 0.291

std. errors: 0.016 0.029 0.023

fixed pat wt dof chisq tail prob

000 0 13 20.801 0.0769555 0.483 0.226 0.291

Armenia is a bit of an enigma here. It does stand out from the Shulaveri Shomu and Hajji Firuz individuals in that they lack any Iran_LN ancestry. The ancestry there is never larger than the standard error, which was around 6%. It seems that we may not have a great representative for Shulaveri Shomu in Armenia. I also looked to see if adding an Iranian Plateau or Central Asian group would help, but they were small contributions and never above the standard error. So, those models were left out.

Arslantepe Late Chalcolithic

Here, I will include two models. The first, is a minimal failure that does not include Steppe input.

left pops:

Arslantepe_LC

TellKurdu_EC

CHG

Iran_LN

numsnps used: 300549

best coefficients: 0.693 0.220 0.086

std. errors: 0.015 0.038 0.031

fixed pat wt dof chisq tail prob

000 0 13 25.383 0.0205459 0.693 0.220 0.086

This second model includes the Piedmont in the pleft, and is a success. Which may be more parsimonious beings that there is a legitimate steppe lineage there. While R1b-V1636 is certainly old enough to be part of the northern ancestry of CHG and there since the beginning, it is more in-line with data to withhold that assumption for the moment.

left pops:

Arslantepe_LC

TellKurdu_EC

CHG

Iran_LN

Piedmont_Eneolithic

numsnps used: 296251

best coefficients: 0.704 0.082 0.125 0.088

std. errors: 0.015 0.048 0.030 0.021

fixed pat wt dof chisq tail prob

0000 0 12 8.727 0.726049 0.704 0.082 0.125 0.088

Sources

Skourtanioti et al (2020) Genomic History of Neolithic to Bronze Age Anatolia, Northern Levant, and Southern Caucasus. https://www.sciencedirect.com/science/article/abs/pii/S0092867420305092

Is there really Basal Eurasian, and or Iranian/Caucasus-related ancestry in Anatolia’s first hunters and farmers? Maybe not…

I have been having a go at some new graphs here to see if there is really any Basal Eurasian in early Anatolians. While I am limited to just a few samples and do not have access to Dzudzuana (Lazaridis et al (2018) yet, it has become quite clear that Basal Eurasian, or Ancient North African is not needed in these samples. And while it was also reported in Feldman et al (2019) that early farmers from Boncuklu harbored ancestry from a group related to Iranian farmers or Caucasus hunter-gatherers, this need not be the case.

While going back to look at d-stats between some of these groups, I noticed some oddities that were produced when using African populations and modern East Asians, with other ancient Eurasians. Modern Africans show a preference for more recent than ancient Eurasians. There’s even a significant preference for Chalcolithic Iranians in 10,000 year old samples from Malawi, which makes no sense. This is probably some type of artifact in the data. This, to me, was creating the impression of a Basal Eurasian branch where none need be found. When you compare ancient Eurasians to each other, it does disappear.

For instance, the Z-scores using Chimp as an outgroup, and even Altai or Denisovan, were completely different than using Mbuti, Mota, or any other African individual or population. The significance of these stats vanished when comparing the first Anatolians versus ancient European hunters.

Not only that, it also disappeared when using ancient East Asians and Native Americans such as Tianyuan, Vietnam_N, Vanuatu_2900BP and Brazil_LapaDoSanto_9600BP. Sure enough, when you compare modern East Asians versus these samples, the modern groups end up being significantly closer to Ust_Ishim and Africans. So, instead of all ancient East Asians having Basal Eurasian, or all modern East Asians having ancestry from Ust_Ishim or some special relationship with Africans, this may also be an artifact. The second is possible, but probably minimally so.

So, what we have is Dstats in the order of (Chimp/Altai/Denisovan, Ust_Ishim; Anatolia_HG/Boncuklu_N, SunghirIV/Kostenki14/Vestonice16/Tianyuan/Vietnam_N/Brazil_LapaDoSanto_9600BP) all being quite insignificant. This had me look into creating some more graphs to look at the issue and deciding to stay away from using modern East Asians and Africans in analysis of ancient Eurasians.

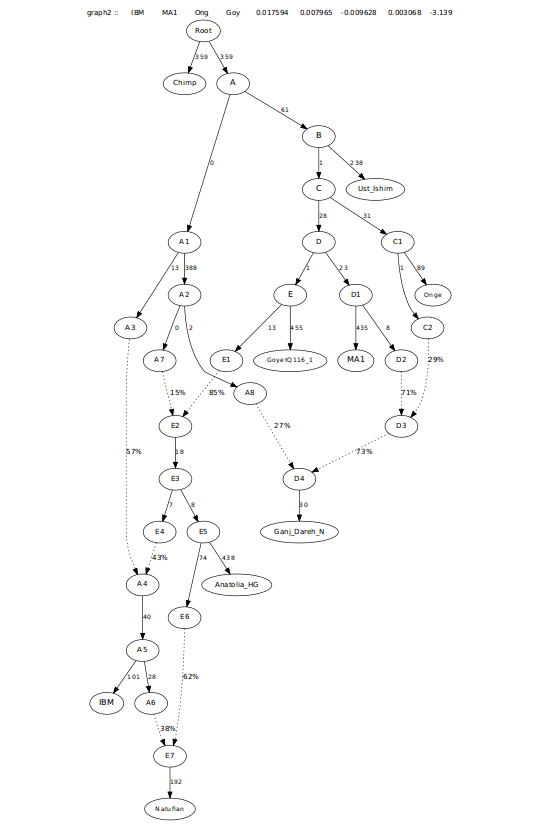
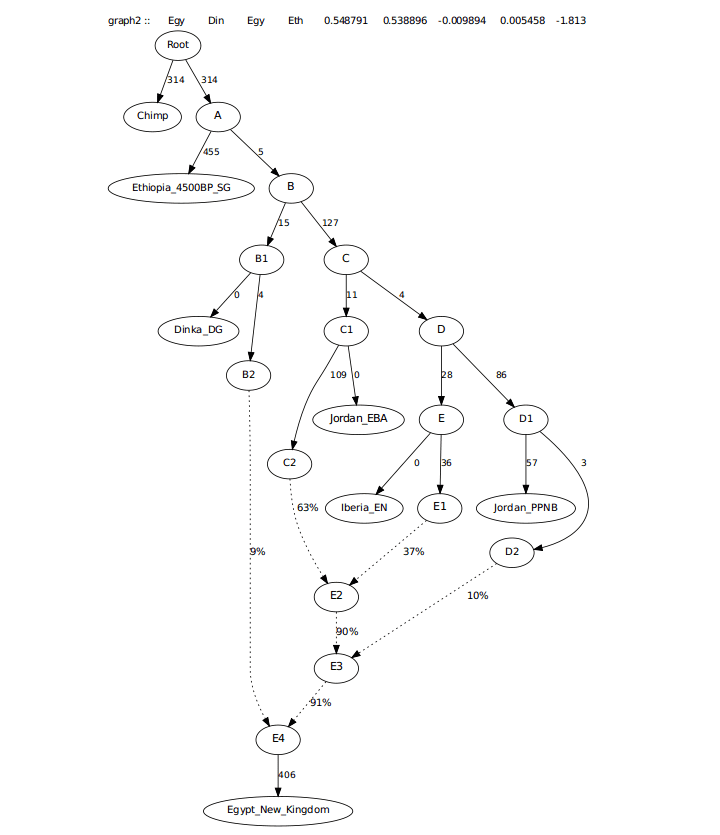
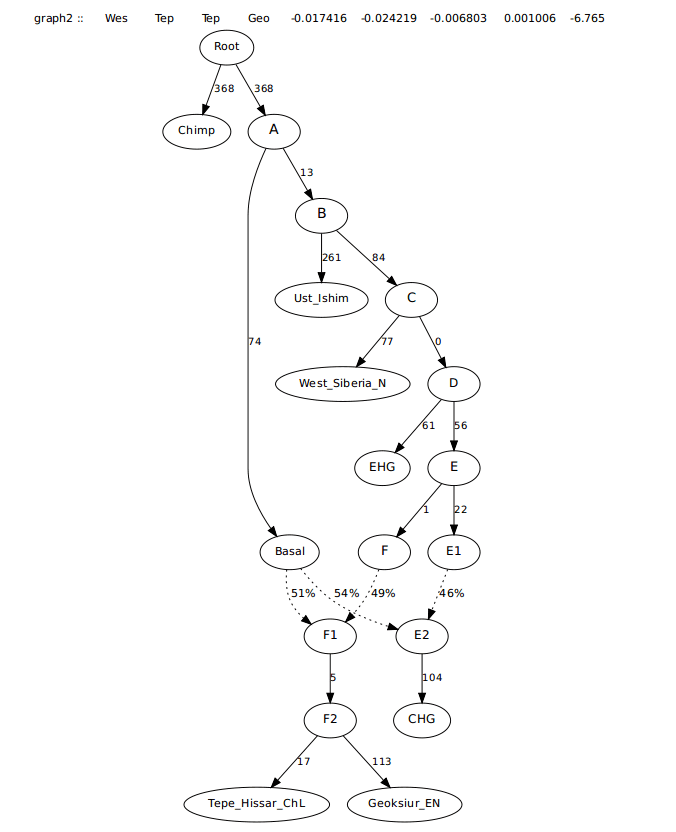
The graph that I ended up with combined Natufians, Iranian farmers from Ganj Dareh, both the Anatolian hunter-gatherer from Pinarbasi and early farmers from Boncuklu, Upper Paleolithic European SunghirIV, Iberomaurusians, and Upper Paleolithic samples from Siberia and China, Ust-Ishim, Yana, and Tianyuan, respectively.

For this graph, I grouped SunghirIV and the Anatolians on a branch together, separate from Ust_Ishim and Tianyuan, as neither show any signs of shared drifted with these groups that the other doesn’t have.


Anatolians2

With this graph, it brings up the interesting prospect that deep ancestry did not reach Anatolia, or the Caucasus with Dzudzuana, but later in the Levant, Caucasus, and Zagros region. With the very minimal excess sharing between Boncuklu and Iran, I chose to use Boncuklu as the population that donates the Anatolian, or Dzudzuana-like stuff to Iran, while the Natufians preferred a source more like Pinarbasi (Anatolia_HG).

Without samples covering a range of time between 30,000-10,000 years ago across all of West Asia, it is hard to say if this will pan out. For now, this is the best that I can do.

While neither the Anatolians or Sunghir share any special relationship with Tianyuan or Ust-Ishim, Yana is significantly closer to Upper Paleolithic Europeans, suggesting they stem from the same branch.

Iberomaurusians fit best as a mix of the so-called Basal Eurasian or Ancient North African and something coming from the same branch as, but before the split of Boncuklu and Anatolia_HG.

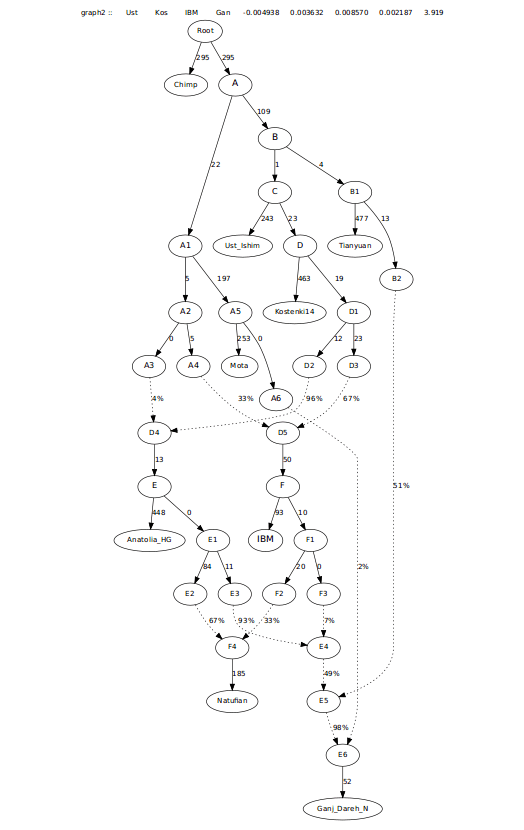
The Iranian farmers first wanted to be grouped with Boncuklu, then onto Yana and Iberomaurusians. Afterwards, there was a Z-score between 2-3 that asked for more ancestry related to Tianyuan, but deep than the branch to Yana, going into Iranians. I had noticed this long ago and included it in previous posts. It does keep the graph together much better as more populations are added as well.

As previously mentioned, I avoided the use of any African or modern East Asian population. I did not want to have any artifacts create unnecessary admixture events or ghost populations.

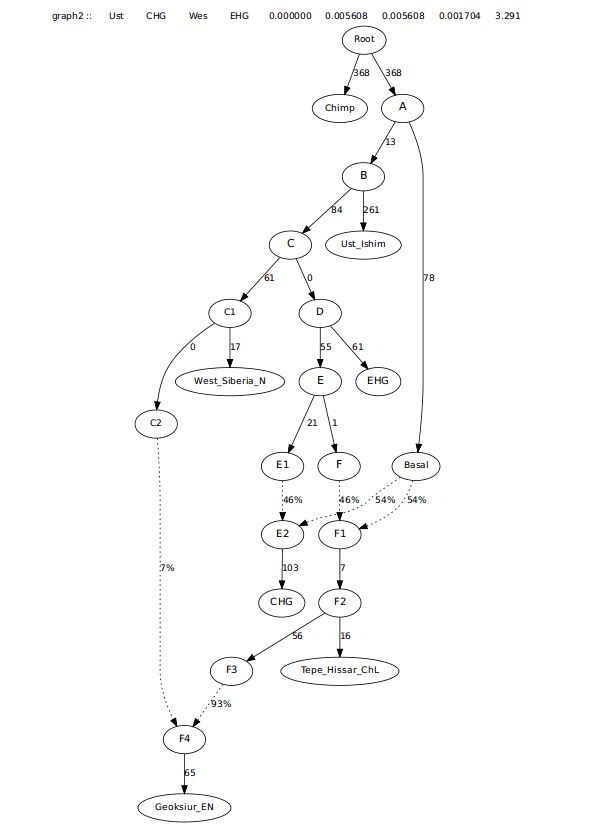
For the next graph, I added in the Gravettian samples from Vestonice. The graph still held together and with an insignificant Z-score.

Anatolians3

For my final go, I decided to add the Epigravettian sample, Villabruna, a 14,000 year old hunter-gatherer from Italy and the reason behind the name “Villabruna cluster”. Villabruna actually shares significantly more drift with ancient Anatolians than Vestonice does, but also significantly more with Ancient North Eurasians (ANE) like Yana and MA1, than the Anatolians do.

For this reason, I chose to make Villabruna, the much younger sample, a mix of Gravettian, Anatolian, and Yana. Due to the fact that there is really no place for some pure population to hide between Dzudzuana and SE European Gravettians, along with the fact that R1b and significant relationships with Native Americans are there, it makes sense that ANE would also be in there. To me, this model feels much more parsimonious than trying to make everyone some mixture involving the much younger population that has no evidence of existing before a much later period. As I said, it is running out of real estate for some place to hide-out for 20-30,000 years.

The major part of the reason I think that this Basal Eurasian or North African was needed in Anatolians, was making them have significant ancestry from Villabruna, who has that relationship with ANE and East Asians over Anatolia. This means that you then must compensate for that relationship not in Anatolia by giving them deeper ancestry that is probably not there. They share enough drift that these tools allow you to branch them together, but then you get caught up in a catch 22 by having to add all of these extra admixture events. For instance, having to make Anatolia a mix of Natufians/Levant, Iran, and WHG, rather than just another branch of West Eurasians that contributes to North Africans, Mesolithic Europeans, and into the Iranian plateau and maybe as far as India before the Neolithic.

In this last graph, Villabruna is a mix of  77% Vestonice and Anatolia_HG (51% and 49% respectively) and 23% from a lineage related to Yana.

anatolians4.png

While there may be new data that makes this impossible, there is certainly nothing there right now to say that it isn’t. There isn’t a single stat out there with ancient Eurasians that can break this tree down as far as I know. I included many populations to make sure that it would hold up. I look forward to seeing more data out of West Asia, and particularly access to the Dzudzuana samples to see if this holds up.

UPDATE:

Just to make things a little more clear, I will show in more detail what I am talking about. It is the use of Africans and modern East Asians that gets in the way of robust analysis of ancient Eurasians. For whatever reason, there is an artifact that draws modern Asians and ancient West Asians much closer to Africans than UP samples from Europe and Asia.

Here are a few d-stats to show what I am talking about..

Chimp Malawi_Ho IBM Ganj_Dareh -0.00011 -0.321 580681
Chimp Malawi_Holocene IBM SunghirIV -0.001876 -4.17 584427
Chimp Malawi_Holocene IBM AnatoliaHG -0.000176 -0.411 507596
Chimp Malawi_Holocene IBM Iran_ChL 0.000235 0.654 569410
Chimp Malawi_Holocene IBM Yana -0.002173 -5.98 589155
Chimp Malawi_Holocene Ganj_Dareh SunghirIV -0.001849 -4.311 581183
Chimp Malawi_Holocene Ganj_Dareh AnatoliaHG -0.000137 -0.33 506101
Chimp Malawi_Holocene Ganj_Dareh Iran_ChL 0.00042 1.45 567512
Chimp Malawi_Holocene Ganj_Dareh Yana -0.002128 -6.497 585873
Chimp Malawi_Holocene SunghirIV AnatoliaHG 0.001456 2.912 507356
Chimp Malawi_Holocene SunghirIV Iran_ChL 0.002128 5.01 569380
Chimp Malawi_Holocene SunghirIV Yana -0.000277 -0.64 591351
Chimp Malawi_Holocene Anatolia_HG Iran_ChL 0.000391 0.959 497265
Chimp Malawi_Holocene Anatolia_HG Yana -0.001986 -4.528 511289
Chimp Malawi_Holocene Iran_ChL Yana -0.002501 -7.398 573952
Chimp MbutiSGDP IBM SunghirIV -0.001592 -4.869 1037166
Chimp MbutiSGDP IBM AnatoliaHG -0.000818 -2.706 836965
Chimp MbutiSGDP Ganj_Dareh SunghirIV -0.001268 -4.134 1003826
Chimp MbutiSGDP Ganj_Dareh AnatoliaHG -0.000363 -1.268 823271
Chimp Mbuti.SGDP SunghirIV AnatoliaHG 0.000712 2.001 847590
Chimp Ust_Ishim SunghirIV AnatoliaHG 0.000044 0.062 845798
MbutiSGDP Ust_Ishim SunghirIV AnatoliaHG -0.000853 -1.281 882870
Tianyuan Ust_Ishim SunghirIV AnatoliaHG 0.000254 0.312 705443

As you can see, there are some things here that seem a little off. It is even worse when you use samples like Ust_Ishim, Yana, and Tianyuan. I can say that it isn’t about there being some type of ancient attraction to Chimp either. The attraction is with Africans. This isn’t only the case for Mbuti, but even ancient Africans like Malawi_Hora_Holocene. Stats are even more significant for the Chalcolithic Iranians, which makes zero sense for 10,000 year old samples from SE Africa. The trees below shows that when you combine Mbuti to here, it doesn’t mess up the Eurasian part of the tree, but requires admixture from those groups into the Mbuti. The first tree is just adding Mbuti to the base of the tree, then the admixture to the Mbuti in the second graph.

mbutianatolians.png

mbutianatolians2.png

The graph above would be even worse if I added a modern East Asian like the Onge. Ths would require Onge admixture to the Mbuti too. All-in-all, I think this shows that if you include an African or modern Asian in your graph to start, you are already setting yourself up for issues here that might affect the outcome. While Chimp is maybe not completely ideal as an outgroup, it is more inline with the graph that has no African or Chimp in it. The stats line up much better with the graph. Not only that, it is apparent that any deep ancestry not covered within in the Ust_Ishim, West, East branching is still easily detectable without Chimp or an African outgroup in the graph.

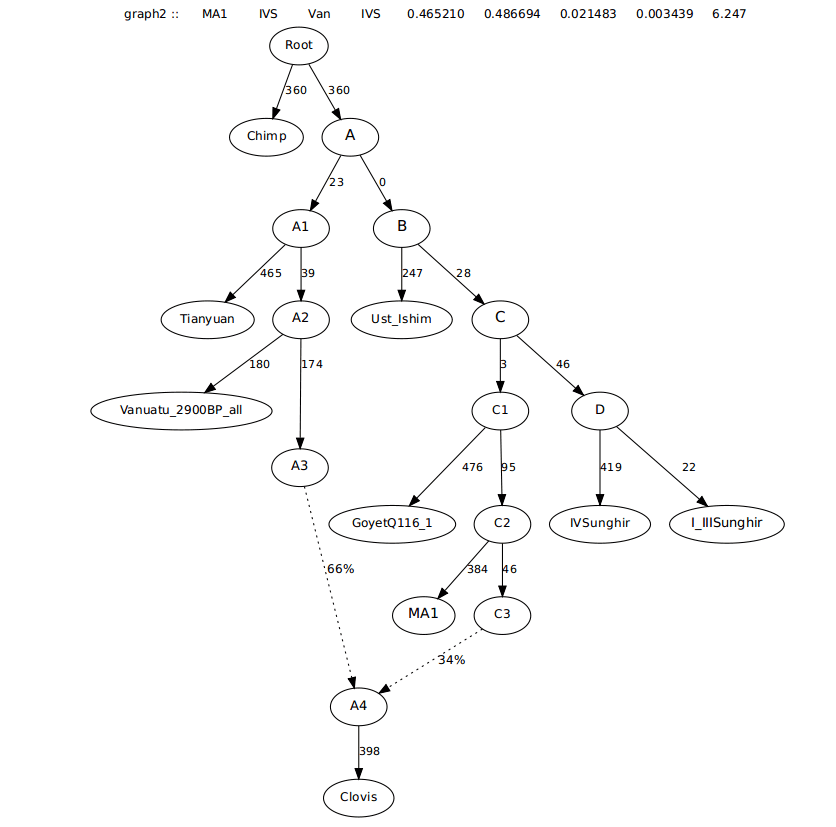
Another little interesting thing with this graph that lines up with the stats is the following comparison between Natufians and Iranians in relation to Yana and Tianyuan. If all East Asian ancestry in Iran was mediated via a Yana-like population, then the stat with Tianyuan should be minimal compared to Yana. However, this isn’t the case and lines up nice with the graph asking for significant East Asian into Iran.

Chimp Tianyuan Natufian Ganj_Dareh 0.00292 4.92 414476
Chimp Yana Natufian Ganj_Dareh 0.00139 2.683 484580

I think this all shows it is definitely safe to run qpGraph with no African or Chimp as an outgroup and running qpGraph with outpop: NULL. Safer, it seems, than including said groups at the risk of affecting analyses.

Sources

Felman et al (2019) Late Pleistocene human genome suggests a local origin for the first farmrs of central Anatolia. https://www.nature.com/articles/s41467-019-09209-7

Lazaridis et al (2018) Paleolithic DNA from the Caucasus reveals core of West Eurasian ancestry. https://www.biorxiv.org/content/10.1101/423079v1


The big picture for West Asia, and specifically Anatolia, after Pinarbasi

Thanks to Feldman et al (2019), we got our first look at the ancient Anatolians from the Pleistocene. Due to the strong cultural links with later peoples, such as Boncuklu, I kind of figured that the hunter-gatherers would be pretty similar to the first farmers. The piece by Baird et al (2013), “Juniper Smoke, Skulls, and Wolves’ Tails“, was very insightful and does hint at continuity in the region.

pinarbasimap.png

grave13.png

To take a look at the formation of the first farmers of West Asia, I used the samples from Feldman et al (2019), Lazaridis et al (2016), and van de Loosdrecht et al (2018) to see what kind of picture emerges.

This first graph, is a simple tree that involves the formation of Boncuklu_N and Anatolia_N (Barcin), while using farmers from Iran and the Levant as additional sources, besides Anatolia_HG (Pinarbasi).


qpGraph Models for the Anatolian Farmers

The first graph is a simple set up of the base populations that are the most likely contributors to the formation of Boncuklu and Barcin. While there may be a better source in Eastern Anatolia or Syria, these will do for now.

simpleanatolia1.png

The addition of Boncuklu to the graph led to a worst-Z score approaching five, asking for admixture between Ganj_Dareh_N and Boncuklu_N.

SimpleAnatolia2

The inclusion of admixture from Ganj_Dareh_N to Boncuklu brought the Z-score down below three and formed a good base for Barcin, and is in general agreement with the findings of Feldman et al (2019).

SimpleAnatolia3

While Anatolia_N is significantly closer to Boncuklu than any of the other populations, there is still a significant relationship with Levant_N shared only with the Barcin farmers.

SimpleAnatolia4

This next graph shows more agreement with Feldman et al (2019), with significant Levant_N ancestry being found in the Barcin farmers. However, there is still a significant relationship between Ganj_Dareh and Barcin that is not resolved.

simpleanatolia5.png

This last graph did bring the worst Z-score to a more acceptable level, around three. This does differ a bit from qpAdm, where you can create a successful model without any Iranian admixture on top of what is found in Boncuklu. The Iranian admixture is essentially at the level of the standard error, making it unnecessary.

SimpleAnatolia6


qpGraph Models for the Mixing Between Populations in North Africa and West Asia from 15,000-10,000 Years Ago

To begin this simple graph, I started with the older samples from each region, with Natufians being a mix between Iberomaurusians and ancient Anatolians, which does fit fine and first demonstrated by Lazaridis et al (2018)(pre-print). Since I do not have the Dzudzuana genomes, I used Anatolia_HG (Pinarbasi) as the stand-in for that admixture into the Iberomaurusians (IBM).

SimpleWestAsia1

For the next graph, I started by adding Levant_N to a branch related to Natufians. I didn’t think starting with Levant_N before Boncuklu_N is a big deal as several of the samples are contemporary and one need not come from the other. The most significant score left from this graph asks for a stronger relationship between Ganj_Dareh and the Levantine farmers.

simplewestasia2.png

After adding an admixture event between Natufians and Ganj_Dareh to create Levant_N, there is still a need for a stronger relationship between Anatolia_HG and Levant_N.

SimpleWestAsia3

This next graph only required minimal admixture from Anatolia_HG (five percent), to bring down the Z-score below 2.

SimpleWestAsia4

For the last tree, I added in Boncuklu and also needed the admixture from Ganj_Dareh to Boncuklu to bring the Z-score down. In this last graph, Anatolia_HG ancestry does overtake Ganj_Dareh ancestry in the Levant_N samples. Anatolia_HG-related ancestry also is the most widespread component in Anatolia, the Levant, and North Africa.

SimpleWestAsia5


Full qpGraph of Ancient Farmers 15,000-10000 Years Ago

For the last set of graphs, I included GoyetQ116-1 and MA1 to cover ancient European to Siberian ancestry.  Ust_Ishim was added to try and figure out the amount of Basal Eurasian that would be needed for each sample. I also included the Onge for any additional East Eurasian ancestry that might be needed.

As a base, I started with just Anatolia_HG, IBM (Iberomaurusians), and Natufians.

newfullwestasia1.png

For the next graph, I included Ganj_Dareh_N as a mix of MA1 and Basal Eurasian. This left a very significant Z-score between the Onge and Ganj_Dareh_N, suggesting additional East Eurasian ancestry is needed for Ganj_Dareh_N.

newfullwestasia2.png

For this graph, an additional 29 percent admixture from Onge to Ganj_Dareh_N helped bring down the worst Z-score significantly.

NewFullWestAsia3

This next graph includes Boncuklu_N, coming from a branch related to Anatolia_HG. The worst Z-score is also suggestive of gene-flow from a population related to Ganj_Dareh_N into the Boncuklu_N farmers.

NewFullWestAsia4

With admixture from Ganj_Dareh_N to Boncuklu, the worst Z-score has dropped to near 3. The next addition to the graph will be Levant_N, from a branch related to Natufians.

newfullwestasia5.png

With the inclusion of Levant_N, admixture is again needed from Ganj_Dareh, to Levant_N, just as with the simpler graphs.

newfullwestasia6.png

With the addition of Ganj_Dareh admixture, the Levantine farmers next needed some extra ancestry from a group related to Anatolia_HG.

NewFullWestAsia7

This last graph shows what is an effective model for the deeper ancestry and mixture between ancient North African and West Asian populations.

newfullwestasia8.png


Discussion

From what I have been able to put together, there is an agreement with the findings of Feldman et al (2019) when it comes to the formation of Anatolian farmers and the importance of the Pleistocene hunters, or a related group, to the formation of not only Anatolian farmers but also Levant_N. The only difference with qpGraph is that it does want additional ancestry from Ganj_Dareh_N into the Barcin farmers. To re-iterate Feldman et al (2019), there is the appearance of great continuity through the development of agriculture in Anatolia, but this could change with more samples, particularly Eastern Anatolia and Syria.


Sources

Baird et al. (2013) Juniper smoke, skull sand wolves’ tails. The Epipaleolithic of the Anatolian plateau in its South-west Asian context; insights from Pinarbasi. https://www.academia.edu/13587260/Juniper_smoke_skulls_and_wolves_tails._The_Epipalaeolithic_of_the_Anatolian_plateau_in_its_South-west_Asian_context_insights_from_P%C4%B1narba%C5%9F%C4%B1

Feldman et al. (2019) Late Pleistocene human genome suggests a local origin for the first farmers of central Anatolia. https://www.nature.com/articles/s41467-019-09209-7#Sec20

Lazaridis et al. (2016) Genomic insights into the origin of farming in the ancient Near East. https://www.nature.com/articles/nature19310

Lazaridis et al. (2018) (pre-print) Paleolithic DNA from the Caucasus reveals the core of West Eurasian ancestry. https://www.biorxiv.org/content/10.1101/423079v1

van de Loosdrecht et al (2018) Pleistocene North African genomes link Near Eastern and sub-Saharan African human populations.


A Working Tree for Ancient Eurasia

For quite some time I’ve been a proponent of early entry of Basal Eurasian into European hunter-gatherers. This looked a little clearer with the likes of the Iron Gates hunters from Mathieson et al (2018). Not only that, but I was noticing some slight shift from the Gravettians from GoyetQ116-1 (Fu et al, 2016), along with the West Eurasian side of ancient Native Americans, such as the Clovis boy (Rasmussen et al, 2014). While this became much more possible with the discovery and modeling of European hunters with the Dzudzuana pre-print (Lazaridis et al, 2018), I also noticed that another, more ancient Eurasian looked to have a good amount of this deep lineage commonly referred to as Basal Eurasian. This sample was Sunghir IV from Sikora et al (2017).

The Sunghir site is one of the most famous and well-studied sites in Upper Paleolithic Europe. The child burials have been subject of much discussion and even VR reconstruction efforts for their faces have produced interesting results (Holger, 2017).

sunghirboy

sunghirkids.png

The interesting thing about SunghirIV is that it was a partial femur that was packed with ochre (Sikora et al, 2017). Not only that, the bone chemistry of this individual pointed to a different geographic place of origin for this individual compared to the other Sunghir remains (Sikora et al, 2017).

Looking at D-stats to Form the Base of the Tree

Several things jumped out at me looking at ancient East Eurasians, both Tianyuan (Yang et al, 2017), and Vanuatu_2900BP_all (Lipson et al, 2018), had the same relationship to ancient West Eurasians and to Ust-Ishim (Fu et al, 2014). Not only that, GoyetQ116-1 and MA1 both shared the same relationship with Ust-Ishim and ancient East Eurasians, unlike the other West Eurasian samples. This suggests that at one time, the from at least 36,000 years ago, there may have existed a huge meta-population stretching from Western Europe, all the way to at least Lake Baikal.

Out Target X Y D-stat Z-Score SNPs
Chimp Tianyuan GoyetQ116 MA1 0.000116 0.132 455312
Chimp Vanuatu GoyetQ116 MA1 0.000022 0.026 276242
Out Target X Y D-stat Z-Score SNPs
Chimp Ust_Ishim GoyetQ116 MA1 -0.000697 -0.864 528039

Not only that, but Tianyuan must’ve branched off very early from the population that leads to both Vanuatu_2900BP_all and the ENA branch mixing into Native Americans, as Vanuatu is significantly closer to Clovis, but Tianyuan is not significantly closer to Vanuatu than Clovis, despite the latter having significant West Eurasian ancestry.

Out Target X Y D-stat Z-Score SNPs
Chimp Tianyuan Vanuatu Clovis -0.001261 -1.9 386513

Still, in that stretch of nearly 37,000 years, it appears there was no flow from West Eurasians into South East Asians.

The next thing I examined was Ust-Ishim’s place within this phylogeny, as it has been said that he was equally related to modern East Eurasians and ancient West Eurasians. However, a different story emerges when looking at ancient East and West Eurasians together. Ust-Ishim becomes a “Basal West Eurasian”, related to the branch that then mixes with ENA to form the clade shared by Goyet and MA1. While not as significantly set in the West Eurasians as Tianyuan is to East Eurasians, it is still the best fit and may be simply that Tianyuan may have that extra 5,000 years of drift from the population split in Eurasia.

Out Target X Y D-stat Z-Score SNPs
Chimp Ust_Ishim GoyetQ116 Tianyuan -0.001916 -2.264 624072
Chimp Ust_Ishim GoyetQ116 Vanuatu -0.001875 -2.23 373102
Chimp Ust_Ishim Tianyuan Vanuatu 0.000375 0.521 385677

Ust-Ishim being closer to West Eurasians, yet West Eurasians (Goyet and MA1) being much closer to East Eurasians than Ust-Ishim led me believe that admixture from an ENA group to a branch descended from a sister clade to Ust-Ishim was the best fit for MA1 and Goyet.

Out Target X Y D-stat Z-Score SNPs
Chimp Tianyuan Ust_Ishim GoyetQ116 0.002363 2.787 624072
Chimp Tianyuan Ust_Ishim MA1 0.002601 3.071 583856
Chimp Vanuatu Ust_Ishim GoyetQ116 0.002612 3.261 373102
Chimp Vanuatu Ust_Ishim MA1 0.002764 3.437 318634

The final piece to the puzzle was to figure out just how SunghirIV fit into this phylogeny. As someone that was not only significantly further from East Eurasians, but also Ust-Ishim, the only thing that seemed to fit this nicely would be Basal Eurasian ancestry.

Out Target X Y D-stat Z-Score SNPs
Chimp Ust_Ishim GoyetQ116 SunghirIV -0.002626 -3.37 724721
Chimp Tianyuan GoyetQ116 SunghirIV -0.00331 -4.132 620480

The only problem that I knew I would face is the confounding factor of East Eurasians being further from Ust-Ishim than Goyet and most of the ancestry in SunghirIV. Although I can see it as a confirmation of sorts of ancestry deeper than ENA into Sunghir, the worst Z-scores are not going to really reflect this but will probably make SunghirIV an island to himself, or involve ENA pops being closer and another West Eurasian being closer to Ust-Ishim.

Out Target X Y D-stat Z-Score SNPs
Chimp Ust_Ishim Tianyuan SunghirIV -0.000498 -0.608 803562
Chimp Ust_Ishim Vanuatu SunghirIV -0.000888 -1.173 430030

D-Stats Showing Relationships Between Ancient “West Eurasians”

The D-stats below show the more outlier status of SunghirIV and the more intermediary position of other ancient Europeans and MA1.

Out Target X Y D-stat Z-score SNPs
Chimp Ust_Ishim GoyetQ116 SunghirIV -0.002626 -3.37 724721
Chimp Ust_Ishim GoyetQ116 SunghirIII -0.001442 -1.983 670463
Chimp Ust_Ishim GoyetQ116 SunghirII -0.001702 -2.339 726072
Chimp Ust_Ishim GoyetQ116 SunghirI -0.001549 -1.946 534517
Chimp Ust_Ishim GoyetQ116 Vestonice16 -0.001394 -1.803 561487
Chimp Ust_Ishim GoyetQ116 Kostenki14 -0.001386 -1.794 702161
Chimp Ust_Ishim GoyetQ116 MA1 -0.000697 -0.864 528039
Chimp Ust_Ishim SunghirIV SunghirIII 0.001054 1.655 998961
Chimp Ust_Ishim SunghirIV SunghirII 0.00094 1.444 1080491
Chimp Ust_Ishim SunghirIV SunghirI 0.001261 1.897 790860
Chimp Ust_Ishim SunghirIV Vestonice16 0.001254 1.714 694500
Chimp Ust_Ishim SunghirIV Kostenki14 0.001499 2.178 1012073
Chimp Ust_Ishim SunghirIV MA1 0.002065 2.652 763784
Chimp Tianyuan GoyetQ116 SunghirIV -0.00331 -4.132 620480
Chimp Tianyuan GoyetQ116 SunghirIII -0.001474 -1.873 574387
Chimp Tianyuan GoyetQ116 SunghirII -0.001893 -2.351 621729
Chimp Tianyuan GoyetQ116 SunghirI -0.001434 -1.738 458764
Chimp Tianyuan GoyetQ116 Vestonice16 -0.002817 -3.472 508391
Chimp Tianyuan GoyetQ116 Kostenki14 -0.003163 -3.926 601682
Chimp Tianyuan GoyetQ116 MA1 0.000116 0.132 455312
Chimp Tianyuan SunghirIV SunghirIII 0.002014 3.032 739525
Chimp Tianyuan SunghirIV SunghirII 0.001629 2.332 800109
Chimp Tianyuan SunghirIV SunghirI 0.001864 2.606 590273
Chimp Tianyuan SunghirIV Vestonice16 0.000527 0.713 607772
Chimp Tianyuan SunghirIV Kostenki14 0.000656 0.921 777500
Chimp Tianyuan SunghirIV MA1 0.003533 4.299 580265

Tree Building in qpGraph

The first run here grouped MA1 and GoyetQ116-1 together, since both showed a similar relationship to East Asians and Ust-Ishim. Clovis was grouped with Vanuatu_2900BP_all, since there was significantly more drift shared with this pop, versus Tianyuan. Ust-Ishim was also placed at a position basal to West Eurasians due to the minor shift towards West Eurasians, versus East Eurasians. SunghirIV and the combination of SunghirI, SunghirII, and SunghirIII were placed together due to their closer relationship as well.

ancient1.png

Since the worst Z-score from this run involved flow between Clovis and MA1, the next step was to create admixture from a branch related to MA1 into Clovis.

Ancient2

As this graph left a worst Z-score require MA1 to be closer to Vanuatu than SunghirIV, I decided to run an admixture edge from a branch related to Vanuatu into West Eurasians, post-Ust-Ishim, due to Goyet and MA1 being equally related to East Eurasians.

ancient3.png

After this admixture edge, there was still a need for MA1 and likely Goyet using D-stats, so I decided to make a “Basal” branch leading into the Sunghir samples.

Ancient4

This next run asked for either more admixture from East Asians to MA1 and maybe Goyet, or a closer relationship between Goyet and Sunghir I-III. So, I decided that an extra relationship between Sunghir I-III was more appropriate here since there is no significant relationship between MA1 and Vanuatu compared to the others.

ancient5.png

Interestingly, this run left a worst Z-score that asked for a closer relationship to Goyet, for SunghirIV. I interpreted this, along with the 0 drift edge on the branch to Goyet and MA1, that Goyet needed to be moved to a more basal position, relative to SunghirIV.

ancient6.png

With this last tree, there is a good drop in the worst Z-score, to where the worst Z-score is now below 3. The relationship left may ask for an even more ancient admixture from an Ust-Ishim-related population into the ancestors of Clovis, but for this exercise, I didn’t find it necessary to capture what I was looking for.

Another qpGraph looking at SunghirIV

I took a couple more looks at SunghirIV, compared to Goyet and the other Sunghir samples, this time including Iberomaurusians, and with another one, the Pinarbasi hunter-gatherer. This first tree includes just the Iberomaurusians, where SunghirIV does ask for deeper ancestry, this shared with Iberomaurusians.

sunghirfinal.png

This last graph shows deep “basal ancestry” shared between IBM, Anatolia, and SunghirIV, with SunghirIV being intermediate between Anatolia and Goyet, and SunghirI-III being intermediate with SunghirIV and Goyet. In agreement with D-stats and other trees.

SunghirI-IVFullwAnatolia

Discussion

While the position of Ust-Ishim and whether or not Asians branch before them does need to be resolved, the position of SunghirIV and the fact that every other West Eurasian is intermediary points to a possible entry of Basal Eurasian to Europe before the time of Dzudzuana. More Aurignacian samples will help to clarify if Goyet is just an outlier, contains some artifact, or is representative of that population. The position of East Asians, relative to Ust-Ishim could be caused by some artifact in the data of ancient East Asians or modern East Asians.

It is also known that mixing modern and ancient samples can also cause issues as there is not only ancient attraction, but potential issues with the mapping, and haploid versus diploid. As ancient samples from East Asia, Europe, and hopefully West Asia come in, this tree may need some tweaking or see some confirmation.


Sources

Fu et al (2014) Genome sequence of a 45,000-year-old modern human from Western Siberia. https://www.nature.com/articles/nature13810

Fu et al (2016) The genetic history of Ice Age Europe. https://www.nature.com/articles/nature17993

Holger (2017) This VR app reconstructs 30,000-year-old homo sapiens faces in 3D. https://vrscout.com/news/vr-app-reconstructs-homo-sapien-faces/

Lipson et al (2018) Population turnover in remove Oceania shortly after initial settlement. https://www.cell.com/current-biology/fulltext/S0960-9822(18)30236-7

Rasmussen et al (2014) The genome of a Late Pleistocene human from a Clovis burial site in Western Montana. https://www.nature.com/articles/nature13025

Sikora et al (2017) Ancient genomes show social and reproductive behavior of Upper Paleolithic foragers. https://www.researchgate.net/publication/320246896_Ancient_genomes_show_social_and_reproductive_behavior_of_early_Upper_Paleolithic_foragers

Yang et al (2017) 40,000-year-old individual from Asia provides insight into early population structure in Eurasia. https://www.cell.com/current-biology/fulltext/S0960-9822(17)31195-8


Tanzania_Luxmanda_3100BP

The spread of the Afro-Asiatic language family is an argument that has several viewpoints. Some might say that it originated within Northeast Africa, and some that think it spread from the Near East.

Skoglund et al (2017) brought us our first East African pastoralist from Tanzania. This group is thought to come from pastoralists from Southern Kenya (Skoglund et al, 2017). In the paper, she was modeled as having ancestry from Levantine PPN farmers, as well as Mota, and the Dinka in another run (Skoglund et al, 2017).

With all this in mind, I decided to try a few different runs myself, including several ancient pops. This included the Levant_N samples, Levant_BA, Iberia_EN (As V88 in North Africa may have a Neolithic origin), Malawi_Chencherere_5200BP, Mota, Iberomaurusians, and South_Africa_2000BP.  I also used the new v37_1240K_HumanOrigins set from Harvard for another run.

qpGraph models of Tanzania_Luxmanda_3100BP

This first graph here is a little more complex, with several populations being used. It would appear that most of the ancestry of Tanzania_Luxmanda_3100BP comes from the Levant_BA, and a source related to the Malawi_Chencherere_5200BP samples which may represent mostly local ancestry from Tanzania.

1tanzania_luxmanda_final.png

This next set-up included most of the samples and had the initial most-significant, worst Z-score with Iberia_EN. Branching them off of Iberia made me have to look for negative statistics with Africans and it built from there, eventually requiring good admixture from the BA samples from Jordan. Even with the Iberian-related admixture, Jordanian-related input was still the most-significant single source. Interestingly, South African input is still required in a decent amount.

Tanzania_Luxmanda_final

qpGraph Models Using the New V37 Set

The last two graphs here were done using the new v37 set from Harvard. I also included South_Africa_2100BP.SG samples in this first run. This more simplified graph from the v37 set was even more significant in the amount of input from a source related to the EBA samples from Jordan, and South African-related input was still strong.

v37tanzania3.png

For this last graph on the v37 set, I switched back to South_Africa_2000BP to see if there were any differences. In this run, the amount of Levant_BA-related input returned to levels more consistent to the other runs, but South African-related input dipped significantly in exchange for more from a source related to Mota.

Tanzania_Last

qpGraph modeling of Egypt_New_Kingdom

Just out of curiosity, I decided to look at the oldest Egyptian samples from the New Kingdom period. This sample is of very low coverage, so extreme caution is urged on the interpretation of this output. Once again, there was a need for European farmer-related input to account for the ancestry in this sample. Also of interest was the fact that Dinka was a preferred population for Sub-Saharan input, over Mota. This may have interesting implications as a minimum date for the appears of N-S speakers into the Nile valley, but again, caution is needed here. In this run, Levant_N does make an appearance, along with a very significant input from a source like the BA samples from Jordan.

Egypt_New_Kingdom

Discussion

While I am getting differences in the West Eurasian input than was found in Skoglund et al (2017), the sources are still very related and I am also using the full 1240K and V37 sets, versus using a more reduced set from panel four and five from the Human Origins set. I think that input from a source that could have both Levant_N and Levant_BA input is quite plausible, and until we have Neolithic genomes from Egypt, it is hard to say how real any request for ancestry from European farmers is. The entrance of V88 to Africa is still a mystery, for now.

The large preference for input from a source more like Jordan EBA, rather than Levant_N may have interesting implications in the spread of Afro-Asiatic, but, as always, more sampling is needed before jumping on the bandwagon here.

As I work forward and dig deeper into Africa, I will possibly revisit this post and see how any output changes. I may also search for outgroups that were not used in Skoglund et al (2017), to see how any output I get from qpAdm may differ from the paper. With any luck, more samples from ancient Africa will help give answers to some of these questions, rather than raise many more.


Sources

Skoglund et al (2017) Reconstructing Prehistoric African Population Structure. https://www.cell.com/cell/pdf/S0092-8674(17)31008-5.pdf


Potential extra Iberomaurusian-related gene flow into European farmers

Thanks to van de Loosdrecht et al (2018) we were able to see the ancient Iberomaurusian, or Oranian people. Not only that, but we see genetic continuity into the Capsian culture, from Fregel et al (2018). I think this is very important to consider as an option for a potential source of this gene flow from North Africa.

I believe this is important due to the fact that Iberomaurusians contain Y-DNA E-M78, and a precursor to E-V13, which is often seen by people as originating in Europe. How it got there has been the big question, and I think this may be the answer. Not only that, there could also be some female-based flow considering that there is J1c, T2b, and H1 among Iberomaurusians (Kefi et al, 2016) and European farmers, but not in Anatolian farmers.

As far as ancient samples, there is E-M78 among Sopot and Lengyel remains, as well as E-13 in Croatia Cardial and the Iberian Cardial. With that in mind, it seems that a mixing in the Balkans and disbursement from there is a more probable option.

I first performed D-stats with European and Anatolian farmers to see if there were any stats that jumped out. While these stats are not largely significant, it does seem that additional flow from Levant_N is not the source of this extra affinity. In fact, even within groups of these farmers, some had Z-scores > 3, in extra affinity to Iberomaurusians, without any significant score with Levant_N. The Bulgarian Early Neolithic samples I0704, I0706, I1298, and I2521 from Mathieson et al (2018) appear as the group with the least affinity to Iberomaurusians, without losing any affinity to Levant_N as well. There are some farmers that will approach or go over a Z-score of 3, but they are the minority. (The relevant D-stat sheet can be found here: https://docs.google.com/spreadsheets/d/1Ohg_6ZHul7PTSMk3vsdm0o0M5qn4ul79FV0rRfnWeIM/edit?usp=sharing )

qpGraph models for input to Cardial Impressa

The first sample that I looked at was Croatia_Impressa 1 and 2, which are samples I5071 and I5072, respectively. The first look here is with Croatia_Impressa I5071. This output showed that this sample can be modeled effectively as deriving about 97 percent of her ancestry from a Bulgaria_N-like source, and another 3 percent from Iberomaurusians.

croatiaimpressa1wibm.png

This next sample, I5072 was also effectively modeled in the same way as I5071, with 3 percent input from a source like the Iberomaurusians.

croatiaimpressa2wibm.png

qpGraph models for input to Iberia_EN

For Iberia, things are more complicated, with WHG input to these samples. Using Levant_N seemed to help in samples with extra WHG, so that they do not end up becoming something like 40 percent Bulgaria_N, 25 percent Iberomaurusian, and 35 percent WHG, or Iron_Gates. The two samples that I used here, Iberia_EN1 and Iberia_EN2, are samples I0409 and I0410.

The first graph here is for Iberia_EN I0409:

iberia_en1wibm.png

The next graph is for sample Iberia_EN I0410:

iberia_en2wibm.png

qpGraph models for input to LBK_Austria

The samples chosen here, LBK_Austria2, LBK_Austria4, and LBK_Austria7 are samples I5069, I5204 and I5207. Since they have some extra affinity to Iron_Gates, they were also modeled in the same way as Iberia_EN. I5069 is the first sample that I graphed.

lbk_austria2wibm.png

Next, is the graph for I5204:

lbk_austria4wibm.png

The last graph is for I5207:

LBK_Austria7wIBMLevant

These three samples, with significant and near significant scores towards Iberomaurusians, are all three pretty similar in ancestry proportions as well.

qpGraph models for input to LBK

The LBK samples that stood out are LBK2, LBK4, and LBK6. These are samples I0022, I0026, and I0048. The first graph is for sample I0022.

lbk2wibm.png

Next, is I0026:

lbk4wibm.png

Lastly, is LBK I0048:

lbk6wibm.png

qpGraph model for input to TDLN (Lengyel and Sopot samples)

The sample that stuck out for analysis was TDLN3, or sample I1891.

tdln3wibm.png

While not having any significant input, the appearance of E-M78 is for some flow from a source related to or more enriched for Iberomaurusian ancestry.

qpGraph models for input to Sopot_LN

The sample used here is Sopot_LN2, or sample I4168.

sopot_ln2wibm.png


Discussion

While these results are providing nothing that one might consider mind-blowing, it does open up a few options. With the only ancient instances of E-M78 being in ancient NW Africa, it is hard to say what was going on between there and the Levant in the Neolithic, as pastoral societies began to emerge. Direct flow from around Morocco or Algeria to the Balkans might be a bit harder to imagine that coming from potentially earlier Neolithic groups in Libya or possibly Egypt.

There is also the chance that the Levantines that mixed into the ancestors of European farmers may have had extra contacts with North Africans before going to Anatolia. Not having an ancient population that looks like a good fit as a direct source to Europe makes this a little harder to decipher.

The clear lack of Y-DNA E throughout Anatolia, but not in Europe is suggestive of extra contacts. The D-stats and graphs to point to potential contacts between the early farmers of Europe and North Africans. Nothing is really conclusive here with regards to how that flow happened, but the uniparentals and specific drift with Iberomaurusians came from somewhere outside of current potential sources, other than the Iberomaurusians themselves.


Sources

Fregel et al (2018) Ancient genomes from North Africa evidence prehistoric migrations to the Maghreb from both the Levant and Europe. https://www.pnas.org/content/115/26/6774

Kefi et al (2016) On the origin of Iberomaurusians: new data based on ancient mitochondrial DNA and phylogenetic analysis of Afalou and Taforalt populations. https://www.tandfonline.com/doi/abs/10.1080/24701394.2016.1258406?journalCode=imdn21

Lazaridis et al (2016) Genomic insights into the origin of farming in the ancient Near East. https://www.nature.com/articles/nature19310

Mathieson et al (2018) The genomic history of Southeastern Europe. https://www.nature.com/articles/nature25778

van de Loosdrecht et al (2018) Pleistocene North African genomes link Near Eastern and sub-Saharan African human populations. http://science.sciencemag.org/content/360/6388/548

Deep tree with a branch related to Mota as “Basal Eurasian”

This is a short post here, before moving onto a larger one with something I find interesting regarding potential flow from Iberomaurusian to European farmers, maybe via the Capsian culture.  I will save anymore on this for that specific post.

I wanted to try a little something that we see often in papers of the couple years, where Mota is used as a stand-in for an ancestral branch called “Basal Eurasian” in modeling on qpAdm.  I don’t recall seeing this in any papers, so I thought that I would give it a try. These are three simple trees, the first involves Chimp, Mota, Ust_Ishim, IBM (Iberomaurusians), Anatolia_HG (Pinarbasi), Kostenki14, Tianyuan, and Natufians. Theses samples come from Lazaridis et al (2016), van de Loosdrecht et al (2018), and Feldman et al (2019).

Technically, I didn’t intend to use a Basal branch, and thought that if anything was needed between Mota and Ust_Ishim, the worst Z-score would require something away from Mota’s branch and diverging instead on the one towards Ust_Ishim, which I should expect if my interpretation of the tree is correct. While I do not want to speculate on Mota’s specific place in tree between “African” and “Eurasian”, nor his potential non-“African” ancestry (I have serious doubts about being able to decipher that after looking at IBM and also potential artifacts with regard to stats involving African samples), I wanted to focus more on seeing if direct ancestry from a related source does work. The results were interesting and did work, just as they do in qpAdm.

While running this, I was curious to see if I could avoid the Z-score between Natufians and IBM with a direct contribution from Mota. This still left a very significant Z-score, showing that direct contribution from a source related to Iberomaurusians was going to be the only way forward.

This was pretty close to the input from both IBM and Dzudzuana, from Lazaridis et al (2018). I eagerly await that sample, to see this a little more. I also wondered about the low Mota to Anatolia edge; thinking it has something to do with what I believe is Kostenki14 already possessing some Dzudzuana-related ancestry, compared to GoyetQ116-1. For the time being, I chose to keep that for later and focus on building this tree.

FullNoBasal1

The next thing I wanted to do was to see how Ganj_Dareh_N fit into all this and if anything beyond Anatolia, Natufians or IBM, and Tianyuan was necessary. To a bit of my surprise, input from Iberomaurusians was quite low, and an extra edge from Mota was needed. Could there be another expansion via a southern route to the Persian Gulf? Potentially, or having more samples near the time of Dzudzuana would show a more deeply branched group in the region. Many things are possible here. While that extra input is small, the Z-score warranted the extra branch to keep that Z-score as low as it is.

FullNoBasal2

The next thing I wanted to check on was how this would change with GoyetQ116-1 being inserted for Kostenki14. I think the results are a confirmation of sorts for some introgression from a Dzudzuana-related pop into all UP Europeans, except for GoyetQ116-1. Meaning that Mota-related input does increase across the board.

FullNoBasal3Goyet

These results are pretty interesting and show that using a branch that splits from a line to Mota does work as a source of deeper ancestry in West Eurasians. The potential artifact with African samples, along with more samples being needed to see the formation of the population Mota comes from are definitely needed to see if the same branching can hold, or if Mota is admixed with some type of Eurasian himself. Maybe Mota is mostly derived from a branch that separated from “Bssal Eurasian” well before admixing into the Near East and North Africa. The interesting thing is that even without Dzudzuana, the results still show Iran needing more input from the deep branch of ancestry and also sizeable ENA input. This is an interesting and exciting time. Hopefully, we will get more samples from Africa and West Asia throughout the Late Pleistocene to see what was going on there.


Sources

Feldman et al (2019) Late Pleistocene human genome suggests a local origin for the first farmers of Anatolia. https://www.nature.com/articles/s41467-019-09209-7#Sec20

Lazaridis et al (2016) Genomic insights into the origin of farming in the ancient Near East. https://www.nature.com/articles/nature19310

Lazaridis et al (2018) Paleolithic DNA from the Caucasus reveals core of West Eurasian ancestry. https://www.biorxiv.org/content/10.1101/423079v1

van de Loosdrecht et al (2018) Pleistocene North African genomes link Near Eastern and sub-Saharan African human populations. http://science.sciencemag.org/content/360/6388/548


Steppe Maykop

Thanks to Wang et al (2018), we got our first look at a group referred to as “Steppe Maykop”. Chernykh (2008) does briefly describe this group in his work, “Formation of the Eurasian “Steppe Belt” of stockbreeding cultures: viewed through the prism of archaeometallurgy and radiocarbon dating”.  He goes on to explain that this is a kurgan using culture outside of the Maykop proper zone,  north of the Kuban and Terek Basins, between the Sea of Azov and Caspian Sea (Chernykh, 2008). These steppe complexes contained Maykop cultural items (mostly pottery) (Chernykh, 2008). The image below, taken from Chernykh (2008), illustrates the location of Steppe Maykop.

Steppe_MaykopandMaykop

Fig. 4.
Circumpontic Metallurgical Province at the early formation stage (proto-CMP).
1 – Maykop culture proper;
2 – sites of the so-called Maykop type (“Steppe Maykop”);
3 – Kura-Araks culture;
4 – late (northern) sites of the Uruk community
carbondatingmakop
DNA results of Steppe Maykop
In the supplementary information of Wang et al (2018), the Steppe Maykop samples showed T2e, H2a1, and U7b. The one Y-DNA resulted in Q1a2. These are some interesting results, especially U7b and Q1a2.
U7b is likely rooted in West Asia between 5-10 KYA (Sahakyan et al, 2017), as it is mostly found in West Asia and Southeast Europe. It almost completely absent from Central Asia, where U7 and U7a are more typically found (Sahakyan et al, 2017). Ancient remains from Central Asia are also giving the same story, with U7 and U7a being the only ones found (Narasimhan et al, 2018). Also interesting is the hot spot of U7b in Georgia (Sahakyan et al, 2017), but this is based on modern populations. These Steppe Maykop samples are our first ancient samples with U7b. With their connection to Maykop, that may be the likely source of this haplogroup.
U7b
Q1a2 is a common haplogroup of Northern Asia and the Americas, showing that relationship to Native Americans that was discussed in Wang et al (2018). Today, it is fairly common among Turkic speakers of Siberia and Northern Central Asia, along with groups in the Americas.
Modeling with qpGraph
I started first by building a tree that included Chimp, Ust_Ishim, Botai, West_Siberia_N, Maykop_Novosvobodnaya, and Progress_Eneolithic. These samples come from Narasimhan et al (2018), Jeong et al (2018), and Wang et al (2018).
1presteppe_maykop1.png
The next thing I did was add Steppe_Maykop to the column designating labels, but did not manually add them to any tree, to find the most significant scores for the first placement. The worst f-stat was Botai, Steppe_Maykop; West_Siberia_N Steppe_Maykop (Z>-49).
To determine if this stat was driven more by Botai or West_Siberia_N, I looked at the Z-scores where only the two were used (Botai, Steppe_Maykop; Botai, Steppe_Maykop and West_Siberia_N, Steppe_Maykop; West_Siberia_N, Steppe_Maykop).
The highest Z-score between the two was -42 between Botai and Steppe_Maykop, versus -30 for West_Siberia_N.
Trying to model this admixture as coming from just West_Siberia_N and not Botai left many 0 drift edges and a worst f-stat approaching 4, likely seeking admixture from Botai and more from Maykop, making it look less feasible. See first graph below. Second one below is the one where Steppe Maykop first branches off of Botai.
2steppe_maykop6.png
3steppe_maykop1.png
3Steppe_Maykop2
This graph left a worst f-stat asking for an edge from Progress_Eneolithic to Steppe_Maykop.
3steppe_maykop4.png
This last graph did have the Steppe_Maykop requiring more Maykop admixture than Progress_Eneolithic, more in-line with the f3-ratio stats (see below). However, I wanted to look at this another way as another way of looking at this created worst Z-scores asking for admixture from EHG, possibly pointing to this group have steppe ancestry that is more like Khvalynsk. Resulting in the tree below.
6steppe_maykopkhvalynsk2.png
I also looked at this admixture potentially coming from Early_Maykop, as the f-3 score for both Maykop groups was similar. This also worked well.
7Steppe_MaykopKhvalynsk

This last one was more in-line with f3-ratio outputs and also resolved the need for extra EHG when removing the 0 drift edge in there.


f3-ratio
I decided to look at f3-ratio as well, to look for confirmation of these results. The results showed significant scores where the two sources were like Botai and Early_Maykop/Maykop_Novosvobodnaya. So, there is some good confirmation here that the models line up.
Source 1 Source2 Target f_3 std. Error Z SNPs
Botai E_Maykop St_Maykop -0.008599 0.002107 -4.081 68545
Botai Maykop_N St_Maykop -0.008444 0.001574 -5.364 126581
Botai Progress St_Maykop -0.003914 0.001447 -2.705 141243
Botai Khvalynsk St_Maykop 0.005247 0.001706 3.075 106850

The f3-ratio using West_Siberia_N as the source 1 pop did produce more significant scores than Botai, but this could be due to the fact that Siberia_N is rather intermediary to Botai and Progress, as well as Khvalynsk.


Discussion

When looking back at all the data, combining the uni-parental markers, along with the statistical output, it seems that a population from around the Urals did move into the region north of Maykop proper, and acquired their cultural material (Chernykh, 2008), along with their genetic input. Since Maykop and Steppe Maykop both have the same carbon dates, it could be that Early Maykop is the better source, but there is limited samples here across that time-frame to really come to that conclusion. Progress and Khvalynsk, or something in-between make a good fit as the steppe ancestry in these ssamples. All-in-all it seems very possible for this to be the story of the genesis of Steppe Maykop, from a source more related to Native Americans, along with more typical West Asian ancestry.


Sources

Chernyk (2008) Formation of the Eurasian “Steppe Belt” of stock-breeding cultures. https://www.academia.edu/22557016/FORMATION_OF_THE_EURASIAN_STEPPE_BELT_OF_STOCKBREEDING_CULTURES.BY_E.N._Chernykh

Jeong et al (2018) Characterizing the genetic history of admixture across inner Eurasia. https://www.nature.com/articles/srep46044

Narasimhan et al (2018) The genetic formation of South and Central Asia. https://www.biorxiv.org/content/10.1101/292581v1

Sahakyan et al (2017) Origin and spread of human mitochondrial DNA haplogroup U7. https://www.nature.com/articles/srep46044

Wang et al (2018) The genetic history of the Greater Caucasus. https://www.biorxiv.org/content/10.1101/322347v1.supplementary-material


Steppe Eneolithic, or Prikaspiiskaya (Caspian Culture) from the “South”


(map created by Rob)

The new Wang et al. (2018) paper has opened up a new can of worms in the formation of Eneolithic steppe cultures. It also has some major gaps that leave room for a lot of speculation. What would be most helpful is samples from the Piedmont between 6000 BCE and 4500 BCE to see the formation of the Prikaspiiskaya Culture.

Vibornov (2016) reiterates a common theme suggesting that this culture originates on the Don at 5500BCE, but migrations from West Asia are also suggested. The only problem with this is that we have samples from Eastern Ukraine, and they are nothing like this. I would find it highly unlikely that this group originated close to here. I think the origin will be closer to the Caucasus, mixing with an early farming wave. Which direction they came from is more of the debate here.

The Meshoko samples presented are far too Anatolian to matter anything to the Steppe Eneolithic, and with good reason. They are 1500 years or more after farmers appear in the region and begin at the tail of Shulaveri-Shomu, which had increased contacts with Halaf in levels IV and V, near the end of the culture (Hamon, 2008). This likely increased the Anatolian ancestry of these farmers.  Meshoko-Darkveti is also influenced by local potters from the Don, one site that saw a deterioration of pottery quality in later sequences (Kozintsev, 2017).

Rob has also provided me with a nice graph here showing the Mesolithic through to the EBA for the region in question.


Chad

Not only this, but the fact that the Prikaspiiskaya differs and drifts towards the South and Eastern Caspian in terms of mud-brick architecture, lithics, and also domesticates. The early Jeitun culture is the first to be heavily dependent on sheep and also goats (Harris et al, 1996), differing from other traditions, such as Mesopotamians with their cattle and pigs. Prikaspiiskaya currently only shows sheep and goats as domesticates. Perhaps another clue as to where the contacts came from.

There are curious cases of potentially unrelated farming groups passing through the West Caspian region. Hajji Firuz shows evidence of an earlier group with different pottery. In Azerbaijan, local farmers, at least by 5900BCE could be the source of Shulaveri-Shomu, rather than farmers coming directly from Mesopotamia. Hajji Firuz has a good amount of Anatolian ancestry, probably far too much for Mesopotamians to make up much of the ancestry of even something as late as Meshoko. I would expect Shulaveri-Shomu to be even more shifted towards Iranian farmers, and even West Siberia Neolithic samples. I expect that Jeitun may be not much different from later farmers in the region, potentially between groups like Tepe Hissar ChL and Geoksiur EN. These groups look more like Iran_LN plus some CHG and West Siberia N-related ancestry.

Without these samples it is really hard to say what happened for sure, with regards to direction of flow. Is Prikaspiiskaya like South Caspian farmers, with the samples we have containing back-flow admixture from Khvalynskaya? It is hard to say. I think the big thing to take away is that this movement from the south happened after 6200BCE, but before 5500BCE. The Don should be ruled out with the Ukrainian samples. That leaves us the first Shulaveri-Shomu, or a Jeitun or Kelteminar-related group somehow navigating to the region, either through the Caucasus, via Azerbaijan, by boat, or around the East Caspian. The interesting link in this might be Caspian fluctuations that brought about an increase of 8m in depth (Naderi Beni et al, 2013) for the Caspian at the beginning of the Jeitun, and ended at the time Prikaspiiskaya appears. There is also evidence of a hiatus at Jeitun just before the beginning of the Prikaspiiskaya. Could some have traveled North? They got their sheep somewhere, and it wasn’t from fully developed SS.

Just to test this out, I tried a few runs with qpGraph, to see if these Eneolithic samples from the Piedmont want admixture from hunter-gatherers, like CHG, or from farmers around the South Caspian. I chose Tepe Hissar and Geoksiur as my stand-ins, as there is not much better of an option at this time. The results were pretty interesting.

I started by making a base graph that included Chimp, West_Siberia_N, EHG, CHG, Tepe_Hissar_ChL, and Geoksiur_EN.

SimpleProgress1

This graph basically just left us with Geoksiur wanting some extra admixture from a population closer to West_Siberia_N, so that is where I went with the second graph.

simpleprogress2.png

With this all set, I went ahead and added Progress_Eneolithic. The first run, with them unattached, showed the strongest Z-score with EHG. So, that is where I placed them for the first run.

simpleprogress3.png

Interestingly, this graph left the most significant Z-scores wanting admixture from a source most like Tepe_Hissar, rather than CHG or even Geoksiur.

simpleprogress4.png

After completing this graph, Progress is now wanting some addition CHG. For the last graph, I put in an admixture edge from CHG, to Progress_Eneolithic.

simpleprogress5.png

What we are left with, is a population that is mostly represented by EHG, with minor CHG, and a good chunk of farmer from the South Caspian. This could represent several things. One is that the hunter-gatherers before 5500BCE were EHG with just minor CHG. Two, could be that the farmers coming in were more CHG-like than Tepe_Hissar, or lastly, that these samples have some back-flow from Khvalynsk, making them more northern. With the samples available, it is really a guessing game. Nothing can be said for certain until there are samples all around the Caspian from 6500-5000BCE. Then, we should know exactly what happened.

Just to try to look for a different result, I tried adding Ust-Ishim to the next set of graphs to see if anything changed. The graphs were as follows:

lesssimpleprogress1.png

lesssimpleprogress2.png

lesssimpleprogress3.png

LessSimpleProgress4

lesssimpleprogress5.png

LessSimpleProgress6

As can be seen from the above graphs, adding Ust-Ishim really caused no issues here. The output is basically identical from the first, less complex run. Next, I wanted to explore the route from the South Caspian, around the East Side of the Caspian Sea. For this, I figured that Iranian Mesolithic samples from Hotu and Belt Cave would do. They do not have much coverage, but beggars can’t be choosers here.

Firstly, I wanted to explore just how Iran_Meso compares to Ganj_Dareh_N with a series of graphs. They went as follows:

IranMeso1

iranmeso2.png

iranmeso3.png

I was quite surprised to see the extra non-basal admixture into Iran Meso was more like EHG than West_Siberia_N. We need more sampling, but a pop closer to EHG down the Caspian is a possibility. Lots could’ve happened between then and the Eneolithic of Central Asia to create an excess of West_Siberia_N ancestry.

The next step was to use simple graphs to see how Progress Eneolithic would look by adding more “Eastern options” for admixture. For this one, I used Iran_Meso, and Eneolithic Caucasus as admixing sources. Ukraine_N was also added, as a Don HG reference to see if it matches those archeological best-guesses.

SimpleProgressIran


SimpleProgressIran1

simpleprogressiran2.png

SimpleProgressIran3

As the above graph progression shows, overall, the genetic make-up of the Progress samples best match the samples outside of the Caucasus. Minimal admixture from Meshoko is all that this graph produced. For the next set, I decided to add CHG. This made it much more complicated, but the overall outcome didn’t change, with CHG only taking a bit from Iran_Meso and Caucasus_Eneolithic.

ComplexProgressIranCHG1

ComplexProgressIranCHG2

complexprogressiranchg3.png

ComplexProgressIranCHG4

ComplexProgressIranCHG5

f3-ratio Test for Admixing Source

Below, testing for an admixing source via f3 revealed no significant stats showing that one is a preferred source in a single event.

X Y Test f3 std. Error Z-score SNPs
CHG EHG Progress -0.001668 0.002449 -0.681 413273
Ganj_Dareh EHG Progress 0.000893 0.002306 0.387 445843
Iran_Meso EHG Progress 0.010461 0.003531 2.963 70383
Tepe_Hissar EHG Progress 0.001471 0.002257 0.652 473798
Hajji_Firuz EHG Progress 0.005077 0.002363 2.149 448044
Tepe_Anau EHG Progress 0.002793 0.002316 1.206 415830
Geoksiur EHG Progress 0.004428 0.002316 1.912 347963
Sarazm EHG Progress 0.004181 0.002509 1.667 352405
Cau_Eneo EHG Progress 0.001736 0.00254 0.683 319180
Iran_LN EHG Progress 0.001374 0.002707 0.508 222793


With all of the evidence here, along with the fact that Iran_Meso seems to fall on a Ganj_Dareh_N > EHG cline, rather than with West_Siberia_N, the question may become how much of the EHG is from North of the Caspian, with Progress? Is it all from Khvalynsk, local HG, or did it all come from East of the Caspian. Some of this could also be due to the excess ENA in West_Siberia_N not being present in Central Asia. Lithics point to movements from the South, towards the Urals, from at least the 8th Millenia BCE. Could some have come with domesticated animals? It certainly seems plausible, as these domesticates in the steppes do not include pigs, which was common in the Caucasus and Europe. Sheep do not occur in the wild in the Urals and European steppes. These are clearly brought in by other people. Could this dead-end R1b be from East of the Caspian? I suppose it is possible with R1b being in Botai, in northern Kazakhstan. R1b being rooted in Central Asia is not a new idea. It could be there as much as 30KYA, or more.

This is all just several possibilities. Considering the lithics are not linked to the Caucasus, but possibly to Central Asia, and the clear links with pottery and even the limited domesticates are pointing there too. FrankN has done a good job summarizing the southern links with the Steppe Eneolithic and checking out that would be of interest to some (www.adnaera.com). Kelteminar is speculated to originate from the South Caspian, in Iran. They very well could be just like the Hotu and Belt Cave samples. Clearly, samples from all around the Caspian, including the Caucasus, are needed between 6500BCE to 5000BCE to really say what happened. Until then, none of us can really say for sure. Hopefully, more sampling will help to shed light on just who these Eneolithic Steppe folks were.


Sources

Harris et al (1996) Jeitun: Recent excavations at an early neolithic site in Southern Turkmenistan. https://www.researchgate.net/publication/271947810_Jeitun_Recent_Excavations_at_an_Early_Neolithic_Site_in_Southern_Turkmenistan

Naderi-Beni et al (2013) Caspian sea-level changes during the last millennium: historical and geological evidence from the South Caspian Sea. https://www.clim-past.net/9/1645/2013/cp-9-1645-2013.pdf

Narasimhan et al (2018) The genetic formation of South and Central Asia.  https://www.biorxiv.org/content/10.1101/292581v1

Szymcsak et al (2006) Exploring the neolithic of the Kyzyl-Kums. https://www.academia.edu/2765764/Exploring_the_Neolithic_of_the_Kyzyl-kums_Ayakagytma_The_Site_and_other_collections

Vybornov et al (2015) The origin of farming in the Lower Volga region. https://revije.ff.uni-lj.si/DocumentaPraehistorica/article/view/42.3/5018

Wang et al (2018) The genetic prehistory of the Greater Caucasus. https://www.researchgate.net/publication/325189972_The_genetic_prehistory_of_the_Greater_Caucasus


Pots, Not People, in Northwest Anatolia?

As pointed out to me, by Rob, it appears there is a new date for a sample from Barcin Hoyuk, in Turkey. This sample (I0707) is now dated to the Mesolithic (9650-9291 cal BCE). This is a huge find, as it changes the view of the way agriculture got to the region, all together. I feel that this may be the biggest thing included in the Wang et al (2018) paper, but others interested in Indo-European studies may disagree. I have contacted the authors to verify this, just to be sure.

Nearly everyone has interpreted the appearance of agriculture in NW Anatolia to some other place in Anatolia, via migration. This often includes Hacilar and Catalhoyuk. This is based on some similarities in pottery, but does ignore the differences in domestic plants in use, as well as the architecture in NW Anatolia.

With this new sample, it appears we may have our first evidence of agriculture and animal husbandry being adopted by a local, or near-local Mesolithic group. Using data available from Mathieson et al (2018) and Lazaridis et al (2016), I decided to compare how this Mesolithic sample compares to the farmers of Barcin, 3000 years later. The results were quite shocking.


Anatolia_N and Meso_Anatolia Form a Clade, With Respect To Other Groups

The following D-stats detail that the average of all farmers and the Mesolithic Barcin sample are nearly identical, only deviating with a Z>2 for Ukraine_N, towards Anatolia_N.

Outgroup Test X Y D Z-Score SNPs
Chimp CHG Anatolia_N Meso_Ana 0.000322 0.792 946889
Chimp Iran_N Anatolia_N Meso_Ana -0.000379 -0.895 751697
Chimp Iron_Gates Anatolia_N Meso_Ana -0.000465 -1.348 945737
Chimp Natufian Anatolia_N Meso_Ana -0.000126 -0.258 454638
Chimp Ukraine_N Anatolia_N Meso_Ana -0.000831 -2.441 877282
Chimp Levant_N Anatolia_N Meso_Ana -0.000047 -0.122 737416
Chimp Hajji_Firuz Anatolia_N Meso_Ana -0.000022 -0.062 879843
Chimp Pponnese_N Anatolia_N Meso_Ana 0.000149 0.435 917602
Chimp Starcevo Anatolia_N Meso_Ana -0.000125 -0.351 880994


F3-ratio test for Potential Admixture

In agreement with the D-stats, there is only one stat that sees a Z-score >3 for admixture going from Meso_Anatolia to Anatolia_N. This was with Ukraine_N, suggesting that there is potentially a pop nearby that contains some of this ancestry. Possibly from around Bulgaria.

Source 1 Source 2 Target f_3 std. Error Z SNPs
Meso_Ana Iron_Gates Anatolia_N -0.00164 0.000896 -1.831 745983
Meso_Ana Ukraine_N Anatolia_N -0.003474 0.000917 -3.787 671035
Meso_Ana Levant_N Anatolia_N -0.000648 0.001014 -0.639 547417
Meso_Ana CHG Anatolia_N 0.001094 0.001347 0.812 691079
Meso_Ana Iran_N Anatolia_N -0.002526 0.001415 -1.785 556216


qpAdm Model of Anatolia_N Using Meso_Anatolia

This testing also showed agreement with D-stats and f3-ratio. Anatolia_N was modeled as a two-way mixture of Meso_Anatolia and Ukraine_N. For the outgroups, I have used Chimp, Iron_Gates, Ust_Ishim, EHG, West_Siberia_N, IBM (Iberomaurusians), Ganj_Dareh_N, Brazil_LopaDoSanto_9600BP, Natufian, and CHG.

The test was also successful in modeling Anatolia_N as a mix of about 97 percent Meso_Anatolia, with 3 percent admixture from a source similar to Ukraine_N.

numsnps used: 520478

best coefficients: 0.970 0.030

std. errors: 0.017 0.017

fixed pat     wt    dof      chisq       tail prob

   00                0        8        5.839      0.665269


qpGraph Modeling of Anatolia_N

As a final check, I ran qpGraph to see if there would be more confirmation of the above stats.

While more complex, I tried to include several pops as the outgroups, or admixture sources in the creation of Meso_Anatolia, and how this compares to Anatolia_N. I have included Chimp as the outgroup, with CHG, Ust_Ishim, Natufians, Iron_Gates, and Ukraine_N as potential sources of ancestry and additional admixture for Anatolia_N. This first graph, is the base of Meso Anatolia, where a mix of a pop similar to Iron_Gates, Natufians, and CHG does well to create the potential source population at Barcin Hoyuk during the Mesolithic.

anatolians1.png

For the next graph, I included Anatolia_N, connected to the Mesolithic Barcin sample. Essentially seeing if they are a clade, as this was the heavy favorite in Z-score, when not attaching Anatolia_N to any one population.

anatolians2.png

These two populations did indeed, essentially form a clade. There isn’t a great deal of reason to improve this, but with the stat connecting Anatolia_N to Ukraine_N, I figured I would explore that and see if improved the fit.

Anatolians3

This final graph actual showed the same thing as qpAdm, and in agreement with D-stats and f3-ratio, with Anatolia_N needing admixture from a population similar to Ukraine_N, at a rate of 3 percent. Depending on the response from the authors, to verify the dating of the sample, it does appear that farming was a local event, potentially adopted by the previous Mesolithic inhabitants.

While this is only based on a single sample, there is enough here to suggest the possibility that the Neolithic package arrived in Barcin through cultural exchange, rather than demographic movements. More high quality samples from other parts of Anatolia will help to see if this holds up. Comparison between the shotgun Boncuklu and Barcin samples may have had some artifact affecting the stats showing movements from the Levant. Soon, I will look back at Europe, as the picture there looks much more complex, with some significant stats towards other populations other than hunter gatherers. This could include from the Levant and Eastern Anatolia.


Sources

Mathieson et al. (2018) The genomic history of southeastern Europe. Nature volume 555, pages 197–203 (08 March 2018) https://www.nature.com/articles/nature25778

Lazaridis et al (2016) Genomic insights into the origin of farming in the ancient Near East. Nature volume 536, pages 419–424 (25 August 2016) https://www.nature.com/articles/nature19310

Wang et al. (2018) The genetic prehistory of the Greater Caucasus. https://www.biorxiv.org/content/10.1101/322347v1.supplementary-material